A selection of pictograms and as featured in the 2016 Bloomberg Impact Report

All pictograms:
-

Control Area
-

Scores
-

Peer Comparison
-

Historical Comparison
-

Metrics List
-

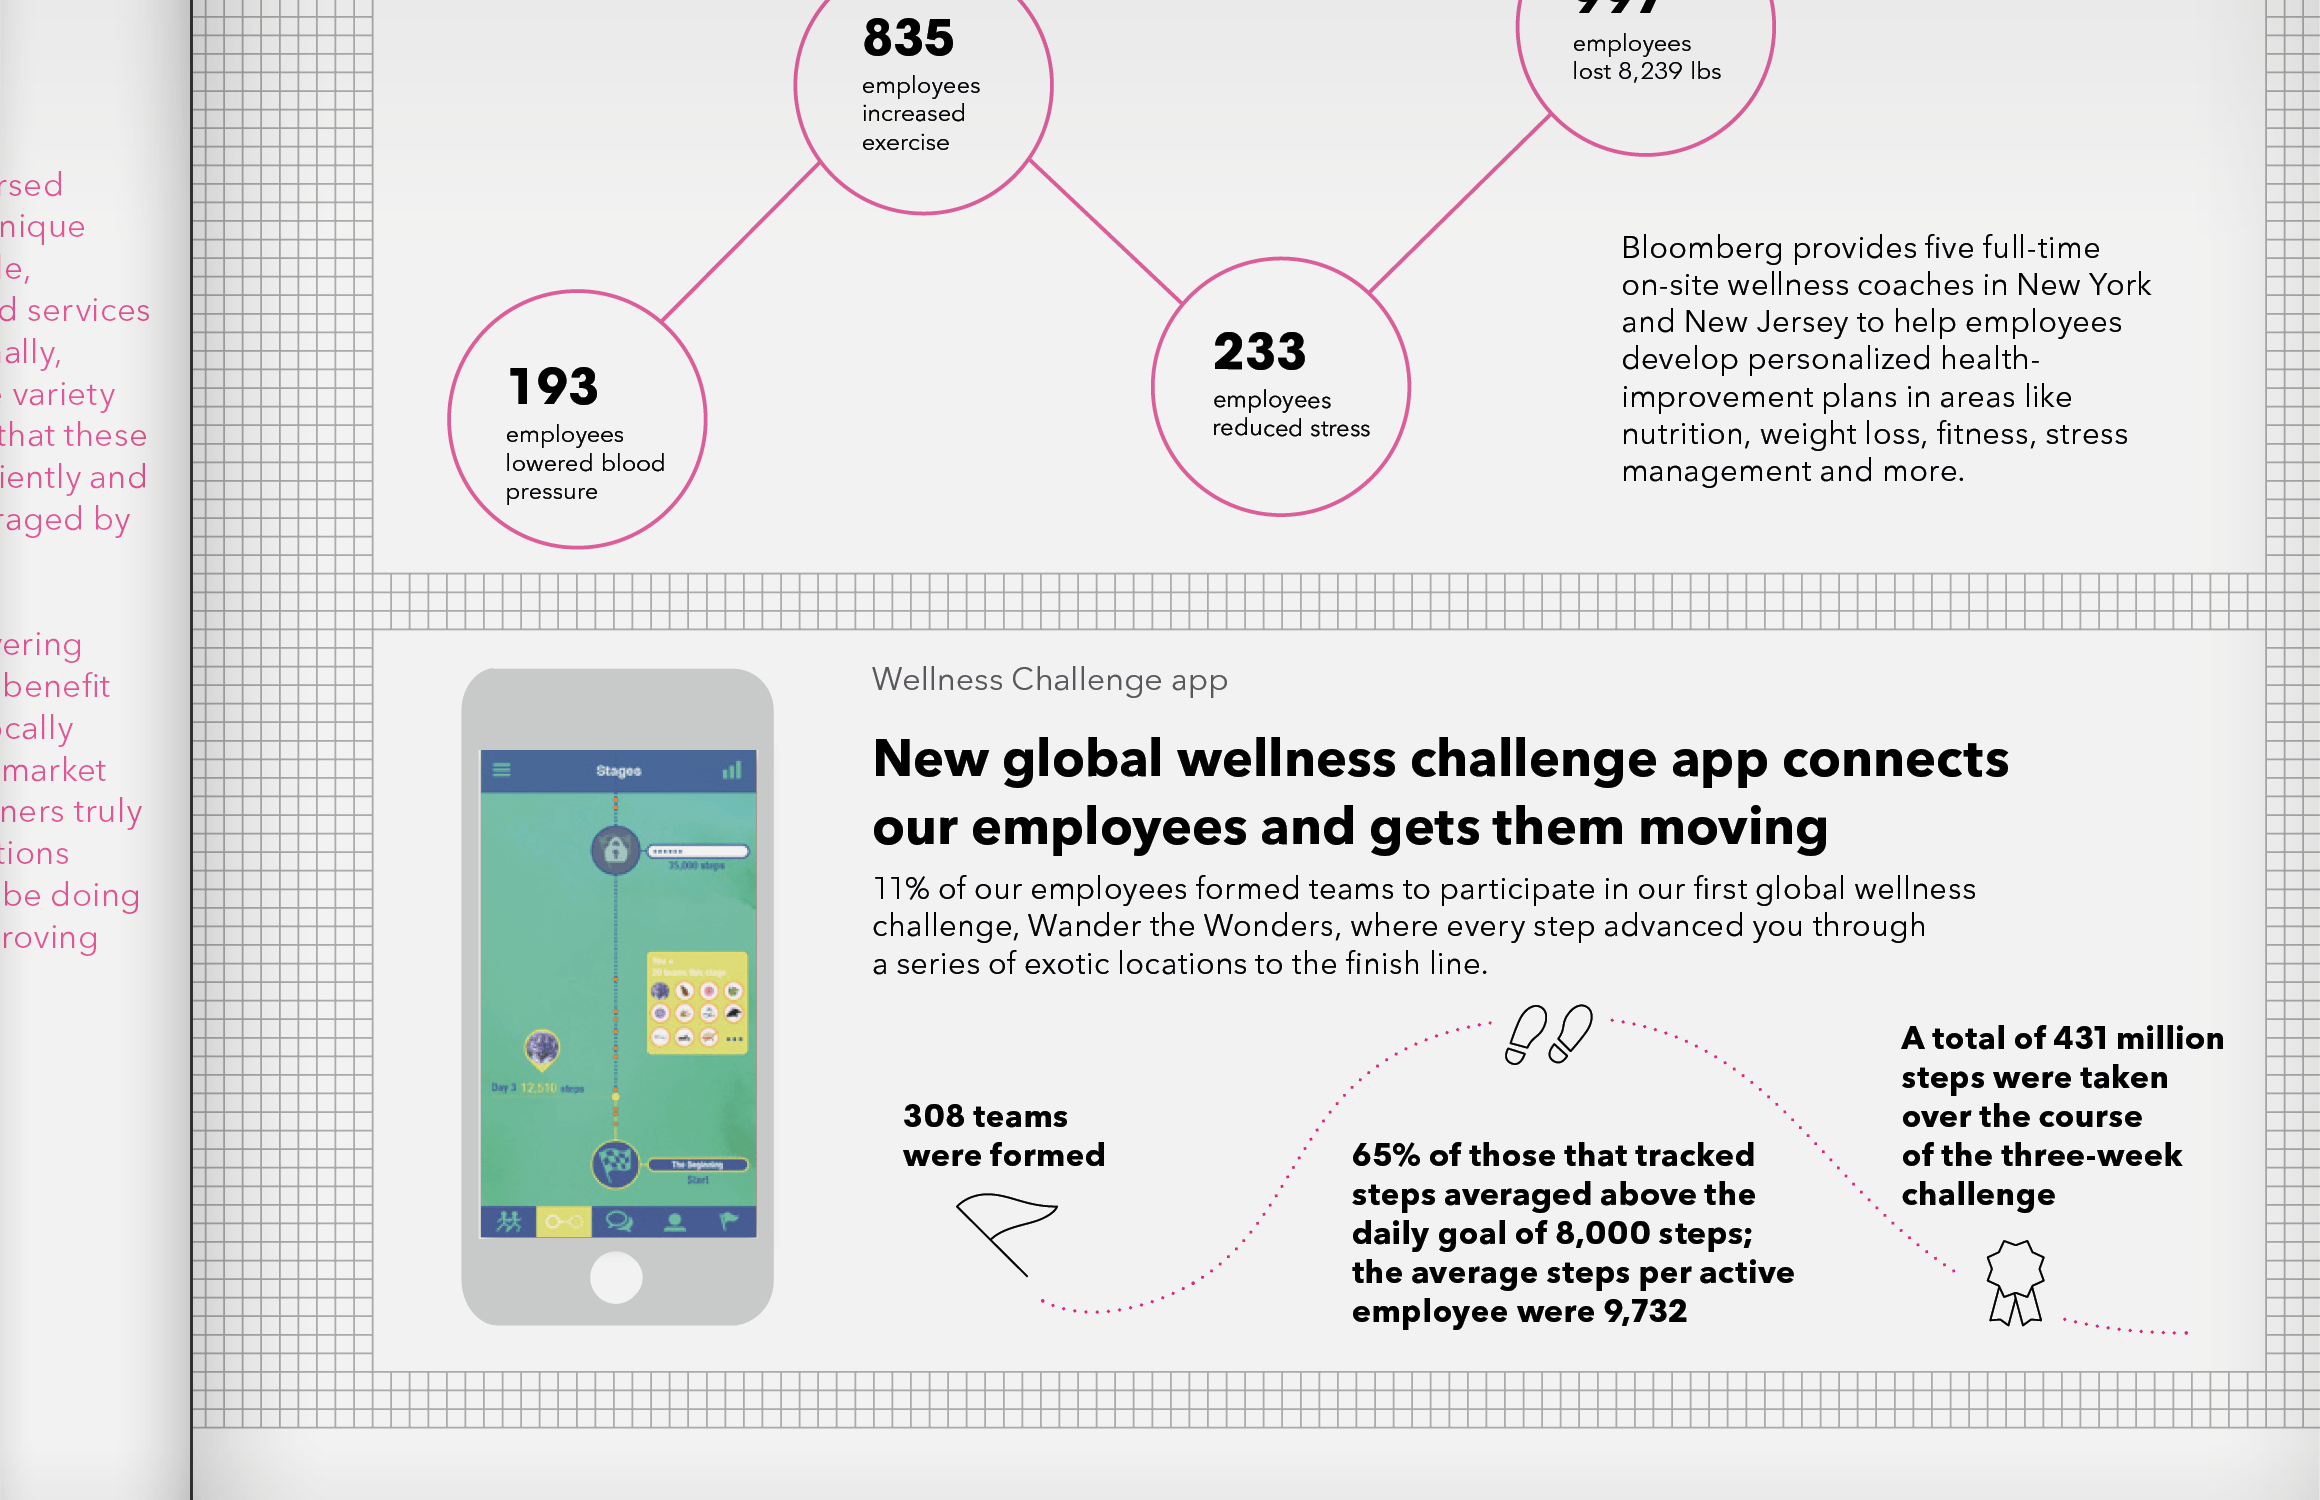
Steps Tracked
-

8 Communities
-

15 Cities
-

308 Teams
-

Accomplishments
-

16 Sponsors
-

44 Chapters
-

Offices
-

Summarize
-

Review
-

Analyze
-
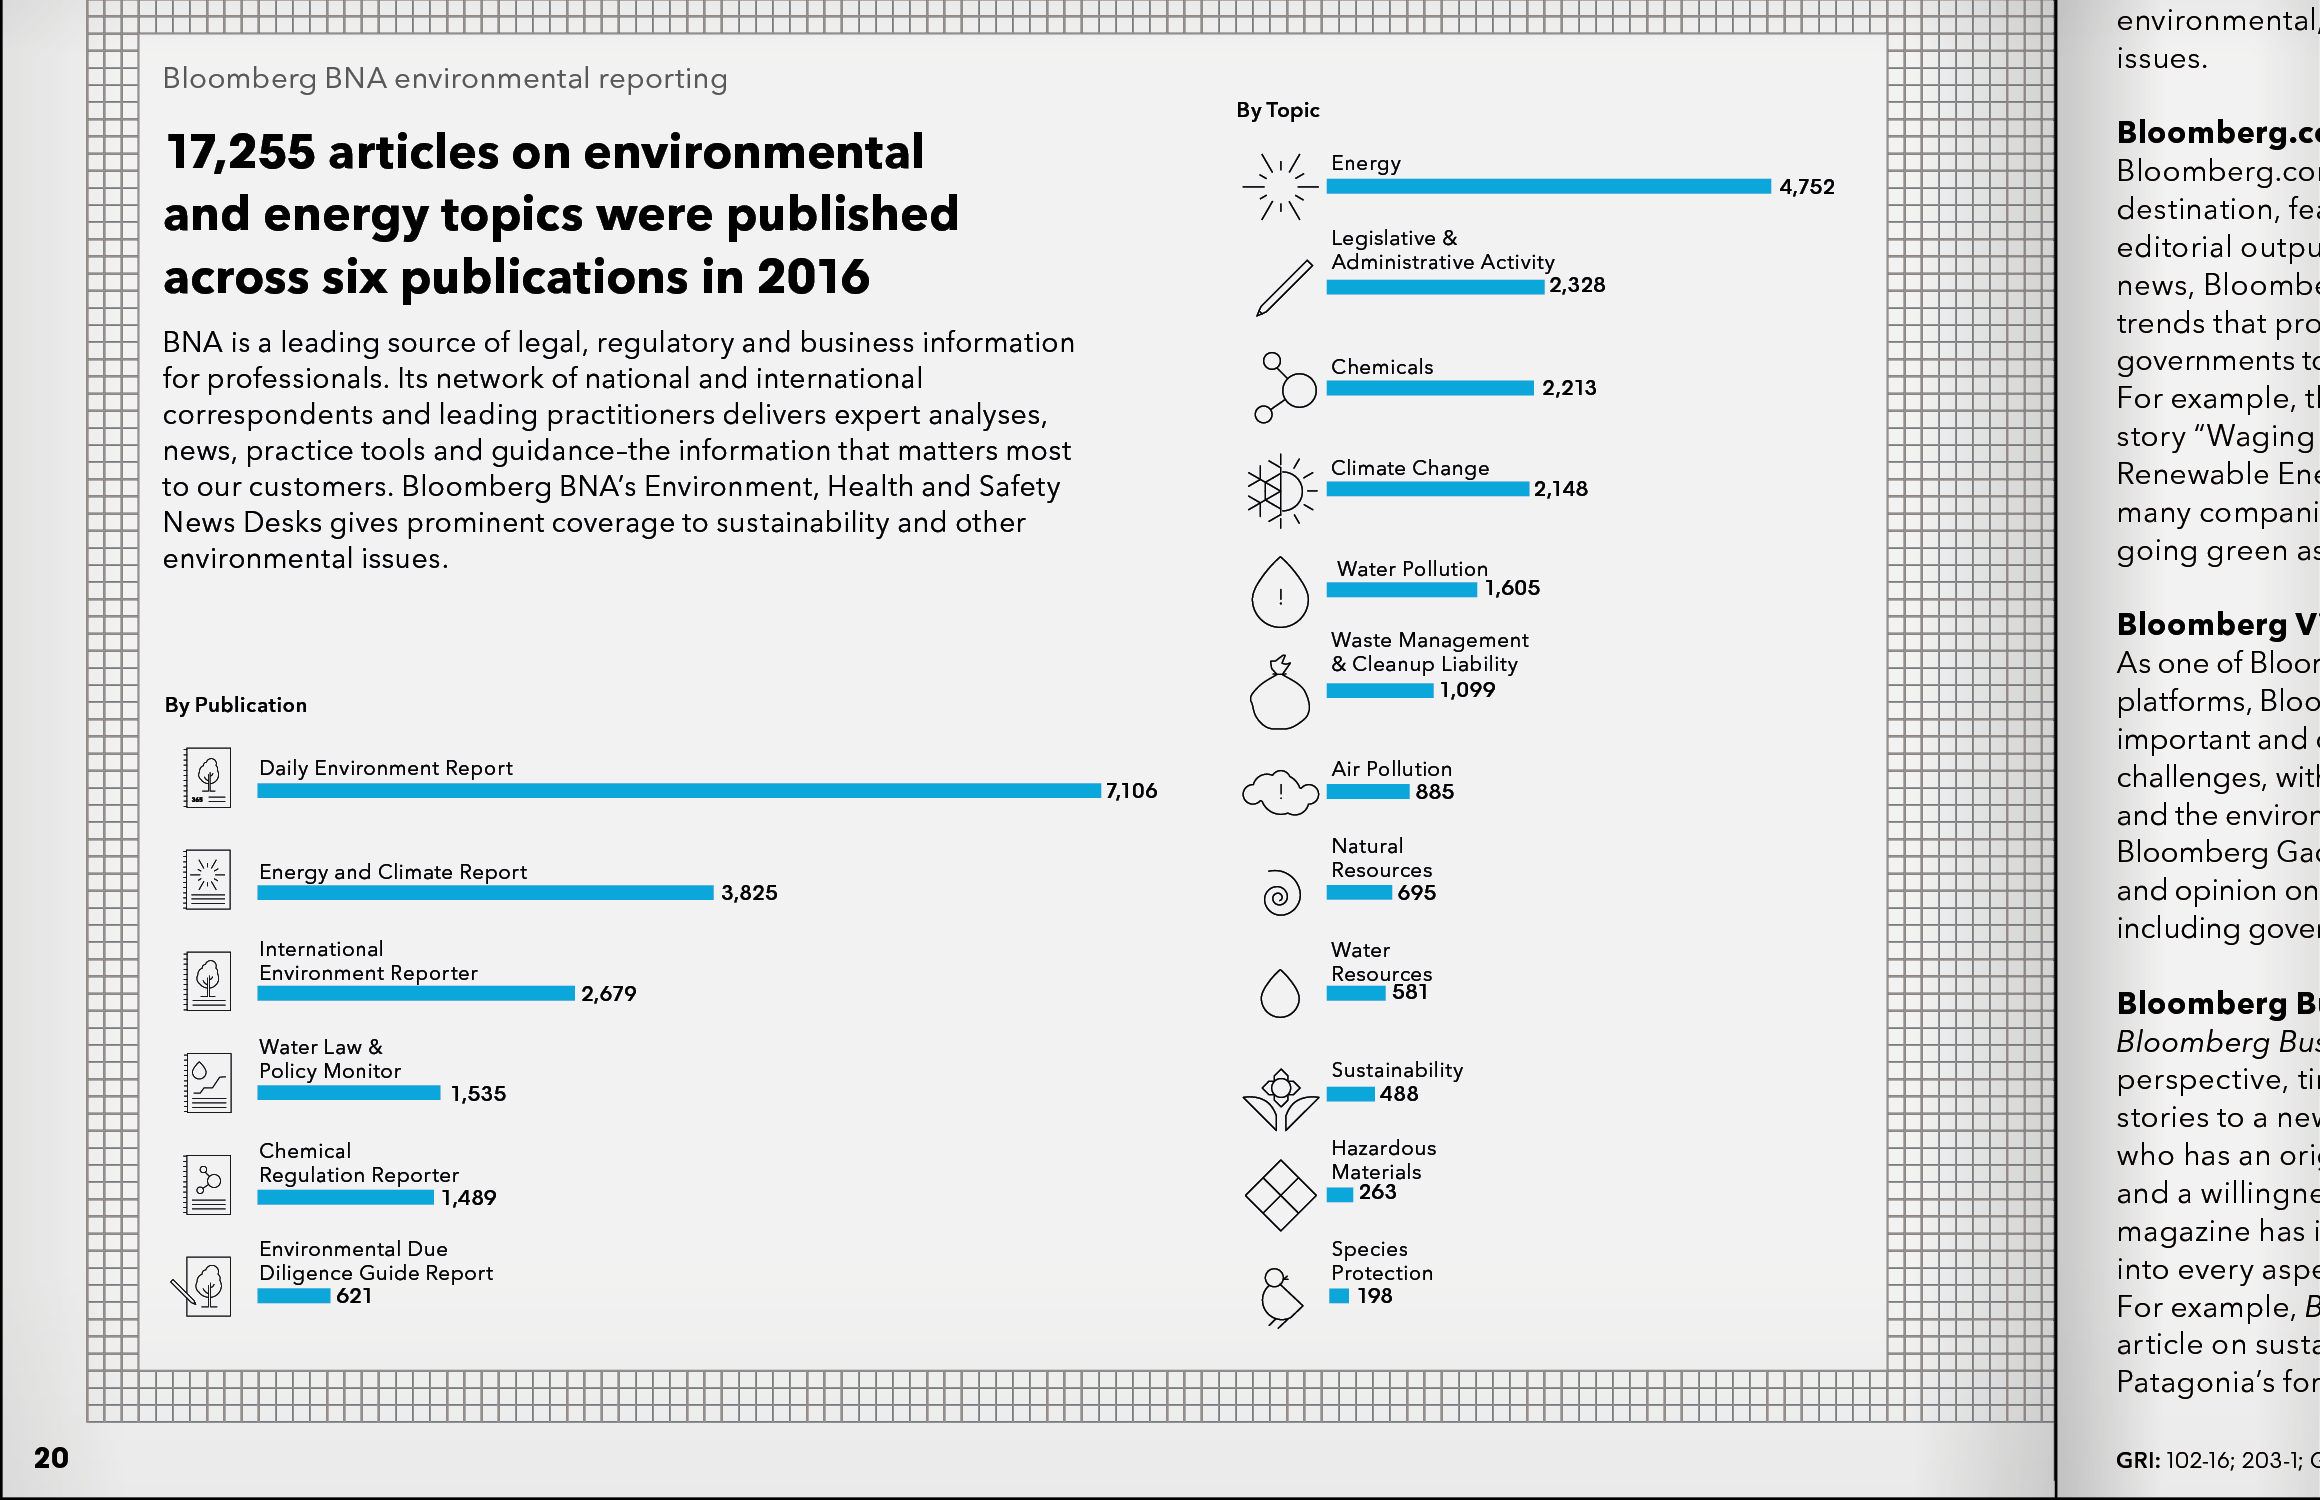
Daily Environmental Report
-

Energy & Climate Reporter
-

Water Law & Policy Monitor
-

International Environment Reporter
-

Chemical Regulation Reporter
-

Environmental Due Diligence Guide
-

Energy
-

Legislative & Administrative Activity
-

Chemicals
-

Climate Change
-

Waste & Management Cleanup Liability
-

Water Pollution
-

Air Pollution
-

Hazardous Materials
-

Education
-

Natural Resources
-

Water Resources
-

Environment
-

Species Protection
-

Human Services
-

Sustainability
-

Customer Engagement
2016
Two Twelve
New York, NY
2016 Bloomberg Impact Report Pictograms
During my internship at Two Twelve I was asked to design various pictograms to be feautured in the 2016 Bloomberg Impact Report. I was given the names for each one and the stylistic direction, then created most of those featured in the report.
All pictograms featured above were designed by me. The report was created by my coworker Matthew Becker.
Impact Report © Bloomberg 2017